Rapid eLearning
58.2K views | +0 today
Follow
Rapid eLearning
Création rapide de contenus eLearning
Your new post is loading...
Rescooped by michel verstrepen from Business and Economics: E-Learning and Blended Learning
Scoop.it!

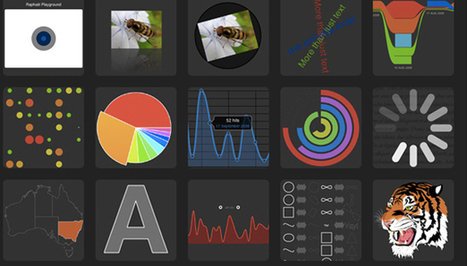
The top 20 data visualisation tools

The top 20 data visualisation tools | Rapid eLearning | Scoop.it

From simple charts to complex maps and infographics, Brian Suda's round-up of the best – and mostly free – tools has everything you need to bring your data to life...

A common question is how to get started with data visualisations. Beyond following blogs, you need to practice – and to practice, you need to understand the tools available. In this article, get introduced to 20 different tools for creating visualisations...


Via Lauren Moss, Baiba Svenca, Jenny Pesina
Randy Rebman's curator insight, January 28, 2013 12:33 PM

This looks like it might be a good source for integrating infographics into the classroom.

Rescooped by michel verstrepen from visual data
Scoop.it!

Infographics Become Easy As Pie, With This Disruptive Font

Infographics Become Easy As Pie, With This Disruptive Font | Rapid eLearning | Scoop.it

Excel is my worst enemy, as I’m a firm believer that spreadsheets should be a punishment mandated only by the federal and state government tax code. And that’s a shame, because you can make some robust graphs in Excel.

FF Chartwell is like a graphing tool for the rest of us. There are no cells to highlight or windows for values. Instead, you simply type the values you want in a graph, separated by plus signs. Then, as easily as you would swap a font, you can highlight the numbers and instantly transform them into several different, sharp-looking graphs...


Via Lauren Moss
No comment yet.